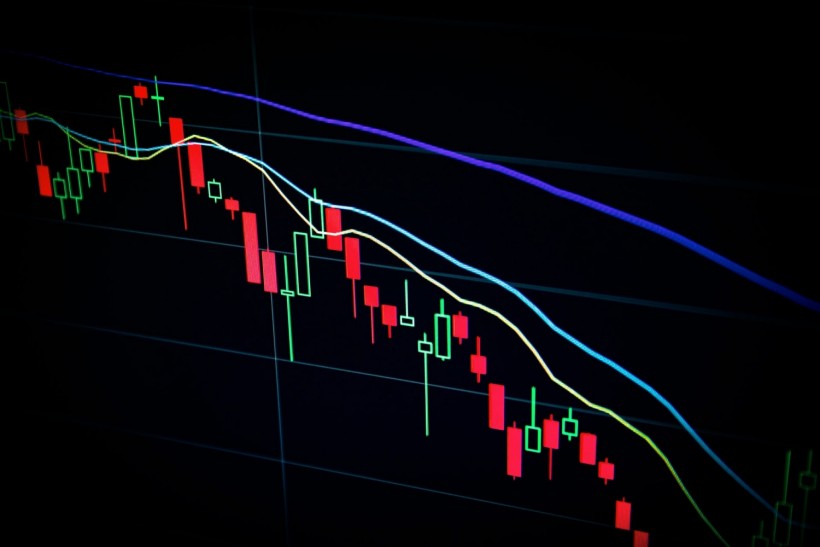
Trading chart patterns are extremely useful to traders, and it helps in understanding which asset is weak and which one is strong, offer precise information about when to sell and buy supplies.
One of the significant purposes of the trading chart patterns is providing competitive superiority over other traders, and helping in earning more profits when used correctly. And in this context, wedge patterns are indeed popular.
What is a wedge pattern?
A wedge pattern is generally considered as a market trend originated while trading assets such as crypto, stocks, bonds, and more. This pattern is differentiated by a decreasing price range associated with an additional upper or rising wedge pattern or a downward falling price trend pattern.
Wedge formation, in simple words, means a pattern development occurring at the higher or lower portion of the trend. The pattern is formed when the trade operators are restricted to closing lines, resulting in a pattern. Usually, a wedge formation takes roughly three to four weeks to complete. This pattern has a tilted slope that springs up or drops down in the same way. Wedge patterns are recurring and do not happen to be a reversal pattern all the time. A reversal takes place when both the support and resistance lines lead in the same direction until one of the trend lines is shot, resulting in a significant volume reversal.
The rising and falling wedge is derived from the parent trend; initial narrowing could be interpreted by observing the trend lines, which later warns that reversal is about to happen. The reversal can be quite critical due to the assertive outlook of the traders who expect the trend to keep going.
What are the types of wedge patterns?
Generally, there are two wedge patterns variants: the rising wedge pattern and the falling wedge pattern.
-
The rising wedge pattern
The rising wedge pattern comes into existence when the market assembles highs and higher lows at the same time, narrowing the trend. The decrease of the trend indicates that the trend is becoming fragile over time, and the pattern will be considered a reversal pattern when it comes to view as an uptrend. This pattern will be tagged bearish during the downtrend because the market span tapers to the adjustment, indicating the adjustment is deprived of power, and the downtrend will soon recommence.
Among the majority of the technical cryptocurrency traders and investors, the rising wedge pattern is famous because of its easy commence and finishing guidelines. A rising wedge pattern has the potential to appear on any provided time frame on a chart, and exhibit speedy progress, making it difficult to notice instantaneously, but not so much if you are familiar with the indications. Soon after an elongated trend, the rising pattern is observed as it effectively aids in trading crypto coins. The pattern guide crypto technical analysts in understanding the current market status, market movements, and the upcoming events, such as; the right time to invest and cash out. It permits the traders to set foot in the market only with short-term investments.
-
The falling wedge pattern
The falling wedge pattern is observed when the market brings out lower lows and lower highs accompanied by a narrowing range. When the pattern is viewed in a downtrend, it is called a reversal, as it indicates the downtrend is losing momentum. When this type of pattern is observed in an upswing, it is known as bullish because the market span narrows down as the correction advance forward, indicating the strength of the negative trend is decreasing, and the uptrend will soon recommence. The two edges of a falling trend shift downwards from left to right, and the top line submerges gradually more than the bottom line. Due to price drop, the volume keeps diminishing, and the trading processes decline. Soon, they approach the breaking point causing the reading activities to change.
The notable difference between a falling wedge pattern and a rising wedge pattern is that, during a downtrend, the falling wedge pattern points to an upward reversal. When the price produces lower lows and highs, this pattern is created. The same happens for an uptrend and lets the traders enter the market.
* This is a contributed article and this content does not necessarily represent the views of sciencetimes.com


![Humans Will Go Extinct on Earth in 250 Million Years; Mass Extinction Will Occur Sooner if Burning Fossil Fuels Continues [Study]](https://1721181113.rsc.cdn77.org/data/thumbs/full/53373/89/56/50/40/humans-will-go-extinct-on-earth-in-250-million-years-mass-extinction-will-occur-sooner-if-burning-fossil-fuels-continues-study.jpeg)


