Author: Sridhar Kakulavaram
kakulavaram@gmail.com
Abstract. Life insurance relies heavily on accurate mortality predictions to manage financial risk and ensure sustainable policy structures. This study introduces innovative approaches to mortality modeling and forecasting, addressing key demographic and statistical challenges in predicting longevity trends. By refining parametric and non-parametric mortality models, this research provides enhanced methodologies for assessing life expectancy, lifespan inequality, and longevity risk—critical factors in life insurance underwriting. The findings contribute to more precise actuarial calculations, enabling insurers to anticipate better financial obligations and optimize premium structures in response to evolving demographic trends.
1 Introduction
Accurate estimation and projection of mortality rates are fundamental to assessing risk in life insurance and pension schemes. Demographic shifts—such as rising life expectancy and an aging population—necessitate sophisticated models that can capture the evolving dynamics of human longevity. Over the centuries, mortality modeling has evolved from early empirical observations to complex statistical methodologies. The techniques presented here refine traditional parametric and non-parametric models, enabling enhanced evaluation of life expectancy, lifespan variability, and longevity risk. Such improvements support more precise actuarial calculations and the design of sustainable premium structures.
The paper is organized as follows. Section 2 reviews key data sources and visualization tools that underpin mortality analysis. Section 3 presents an overview of the historical and modern approaches to mortality modeling, while Section 4 examines contemporary forecasting methods. Section 5 discusses advanced modeling techniques, including decomposition and mixture models that capture the heterogeneous aspects of mortality over the lifespan.
2 Preliminaries
A clear understanding of mortality data is essential for constructing reliable models. The Lexis diagram remains a fundamental instrument for illustrating individual life trajectories and aggregate mortality trends. This tool plots age and calendar time, thereby revealing the progression of cohorts and highlighting key
mortality events. High-quality datasets, such as those provided by the Human Mortality Database (HMD), supply the necessary information on births, deaths, and population counts across multiple countries.
3 Mortality Modeling
The evolution of mortality models began with early efforts to describe age-specific death rates mathematically. Initial formulations, such as that proposed by DeMoivre, assumed a linear decline in survivorship:
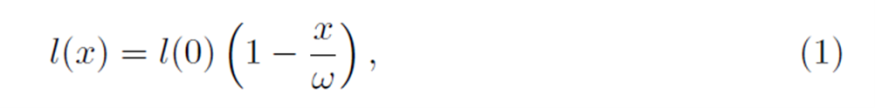
where the corresponding force of mortality is given by
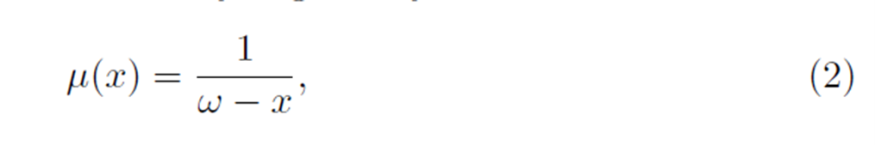
with ω representing the maximum attainable age.
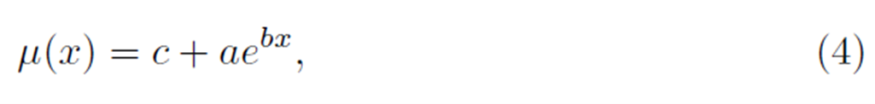
Subsequent advancements introduced exponential models to capture the rapid increase in mortality with age. The Gompertz law expresses this trend as:

where the parameter a sets the baseline mortality and b governs the rate of increase. Later, incorporated an additional age-independent component:
thus offering a more nuanced depiction of mortality risk across different ages. At advanced ages, logistic-type models, such as the Kannisto formulation,
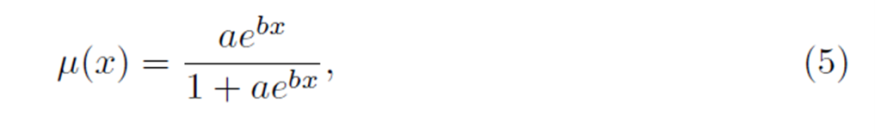
provide improved fits by accounting for the deceleration in mortality increases.
4 Mortality Forecasting
Forecasting mortality trends is critical for financial institutions managing long-term liabilities. Reliable projections facilitate better planning for pension payouts and life insurance claims in the context of an aging demographic. One of the most influential models in this area is the Lee-Carter framework:
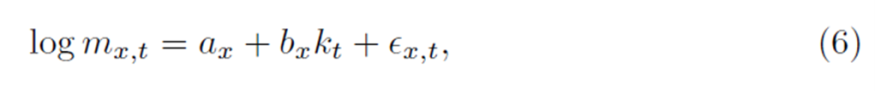
where it represents the age-specific baseline mortality, bxquantifies the responsiveness of mortality at age x to changes in the mortality index, and is the error term. This model has been widely adopted due to its ability to capture historical mortality trends and forecast future patterns effectively.
5 Advanced Mortality Modeling Techniques
5.1 Early Mortality Laws
The initial mathematical descriptions of mortality laid the groundwork for contemporary actuarial science. Early models, such as those proposed by DeMoivre and Gompertz, provided first-order approximations of the age-related risk of death. While DeMoivre's approach relied on a simple linear decline in survivorship, Gompertz's exponential model demonstrated the rapid acceleration of mortality risk during adulthood. These pioneering models continue to serve as benchmarks for evaluating more complex methodologies.
5.2 Decomposition Models
Human mortality exhibits distinct phases, with varying patterns evident in childhood, adulthood, and old age. To address these differences, decomposition models partition the overall mortality rate into several additive components. Thiele introduced an approach that represents the force of mortality as a sum of age-specific risks:

where each term corresponds to different stages of life. Extensions of this framework include Siler's five-parameter model, which integrates early-life and age-related risks, as well as the more detailed Heligman-Pollard and Kostaki models that provide enhanced fits over the entire age spectrum. Recent mixture models further refine mortality forecasts by accommodating shifting and compressing mortality trends, thereby offering a flexible tool for advanced actuarial analysis.
5.3 Mortality Forecasting
Mortality models that capture the age-specific risk of death at a given time or for a single cohort are instrumental in describing historical trends. However, anticipating future mortality conditions requires models that integrate both the age and period (calendar year) dimensions, resulting in age-period frameworks that are critical for life insurance and pension risk assessments.
A comprehensive review by Booth [?] identifies three fundamental approaches to demographic forecasting: extrapolation, expectation, and explanation. Extrapolative methods dominate practice, as evidenced by their widespread adoption among statistical agencies and international organizations [?, ?]. Historical mortality forecasts date back to early twentieth-century actuarial analyses, when English actuaries explored the financial implications of increasing longevity on pension reserves [?]. For instance, annuitant tables from the London Institute of Actuaries in 1924 were generated by extrapolating age-specific death probabilities observed during 1900–1920 [?].
A significant advancement occurred with the introduction of the Lee-Carter (LC) model [12]. This model expresses the natural logarithm of central death rates as:

To mitigate these limitations, several extensions have been proposed. For example, Lee and Miller [?] suggested a post-estimation adjustment to the mortality index to align forecasts with observed life expectancy, while Booth et al. [?] modified the index to reproduce the age-at-death distribution better. Extensions to include cohort effects [?] and smoothing techniques based on functional data analysis [?] have further enriched the forecasting landscape. Alternative models—such as the two-factor model for logit death probabilities by Cairns et al. [?] and tensor product B-spline approaches [?]—offer additional flexibility in capturing non-linear trends.
Another emerging avenue focuses on forecasting life expectancy directly. Models such as those developed by Torri and Vaupel [?] and the Bayesian hierarchical approach by Raftery et al. [?] provide probabilistic projections of life expectancy, which are particularly relevant when assessing longevity risk. Efforts to incorporate coherence across populations, as in the modified LC models by Li and Lee [?] and subsequent works [?, ?, ?, ?], ensure that long-term forecasts do not diverge implausibly among comparable groups.
5.4 Parametric Mortality Models
Parametric models have long served as fundamental tools in demographic and actuarial studies, especially when precise and smooth mortality curves are required for risk evaluation. Such models assume a specific functional form to describe the age pattern of mortality, offering advantages in terms of smoothness, parsimony, and analytical tractability.
In actuarial practice, parametric models facilitate data smoothing, life table construction, and the derivation of mortality forecasts, all of which are essential for calculating premiums and reserves in life insurance. Their ability to interpolate mortality rates at any given age also allows for meaningful comparisons across different populations and time periods [?, ?].
Historically, classical models such as those of DeMoivre, Gompertz, and Makeham have provided the groundwork for understanding human mortality.
Over time, these models have been refined to account for non-monotonic hazard functions, as seen in the use of Log-Logistic and Log-Normal formulations in certain clinical settings [?]. Furthermore, modern applications often incorporate mixture models and frailty components to capture the heterogeneity inherent in population mortality data [?, ?].
5.5 A Brief History of Parametric Mortality Models
The quest for a universal law of mortality dates back to the early compilations of life tables by Graunt [?] and Halley [?]. One of the earliest mathematical representations was proposed by DeMoivre [?], whose linear formulation set the stage for subsequent developments. Gompertz [?] introduced an exponential increase in mortality with age, later refined by Makeham [?] to include a constant risk component. Thiele [?] further extended these ideas by decomposing mortality into components that reflect different life stages—a concept that has influenced later models such as those by Siler [?] and Heligman-Pollard [?].
The logistic formulation, initially recognized by Perks [?], evolved into models like the Kannisto formulation for smoothing mortality at advanced ages [?], and the Gamma-Makeham model introduced by Beard [?]. Models such as the Weibull, originally proposed for reliability analysis [?], have also been adopted for demographic research due to their flexible hazard structures [?]. Recent advancements include the use of Extreme-Value models, which offer promising alternatives for forecasting mortality under varying conditions [?].
5.6 Research Objectives
The primary objective of this investigation is to demonstrate that several established mortality models can be reformulated within the location-scale (LS) framework. This re-parameterization isolates two interpretable parameters corresponding to the shifting (postponement) and compression (concentration) of mortality over age. Such reformulation not only simplifies the estimation process by reducing parameter correlations but also enhances the clarity of demographic interpretations. The resulting models offer improved analytical precision, thereby facilitating more accurate assessments of longevity risk in the context of life insurance underwriting.
The paper is structured as follows. Section 6 outlines the methodological framework, including the LS family of models and the associated estimation procedures. Section ?? presents empirical illustrations by evaluating mortality dynamics in high-longevity countries and comparing parameter correlations across populations. Finally, Section ?? provides a discussion of the findings, emphasizing the implications for actuarial risk management and avenues for future research.
6 Methods
6.1 Overview of Selected Parametric Mortality Models
Table 1 summarizes a selection of well-known parametric mortality models, including those belonging to or related to the LS and LLS families. The table lists the model's name, its classical formulation, the corresponding LS/LLS representation, and key characteristics relevant to life insurance risk assessment.
6.2 Data and Estimation Procedure
The empirical illustrations utilize unadjusted mortality data from the Human Mortality Database (HMD, 2019). Specifically, death counts (Dx) and exposures (Ex) by single year of age are considered for countries with records extending from 1960 onward. This selection encompasses 33 countries (and 39 distinct populations), including Australia, Austria, Belgium, Canada, Denmark, France, Japan, Sweden, and the USA, among others. Countries with shorter time series (e.g., Chile, Greece, Israel) are excluded to ensure robust temporal analyses.
In the context of life insurance risk assessment, the un-smoothed raw data serves as a benchmark to evaluate the performance of the parametric models. Parameter estimation is carried out using maximum likelihood techniques, with goodness-of-fit judged by the model's ability to capture observed mortality trends and its capacity to generate plausible forecast trajectories. Advanced computational routines have been employed to optimize the estimation process, reducing biases arising from multicollinearity among parameters.
6.3 Parametric Mortality Models
Parametric models elegantly encapsulate human mortality using a few essential parameters. These models not only smooth random fluctuations in death rates but also provide the backbone for constructing life tables—an indispensable tool in life insurance pricing and reserving. Where the parameter a establishes the baseline risk, and b governs the speed of increase.
The straightforward nature and clear interpretability of these models make them highly valuable in actuarial analyses.
6.4 Historical Evolution of Mortality Modeling
The systematic study of mortality originated with early demographers such as Graunt and Halley, whose pioneering life tables set the stage for modern survival analysis. Later, theorists including DeMoivre, Gompertz, and Makeham transformed basic survival concepts into mathematical models that capture key aspects of human mortality. Over the centuries, advances in statistical methods and the availability of more comprehensive data have refined these classical models, enabling more accurate forecasts of future trends and improved management of longevity risk.
6.5 Study Objectives
The main objective of this research is to reframe conventional mortality models within a streamlined structure that emphasizes two critical dynamics:
- Shift: A measure of the postponement of mortality.
- Compression: An indicator of the concentration of deaths around a central age.
This reformulation reduces estimation complexity and enhances demographic insights, which are crucial for designing sustainable premium structures and mitigating financial risks associated with extended lifespans.
7 Methodology
7. 1 Foundations of Life Tables
Life tables are essential in summarizing survival patterns across ages. They express the probability of surviving to a specific age in relation to the cumulative mortality rate. This relationship forms the basis for numerous actuarial calculations, providing a concise summary of the population's survival experience.
7.2 Data and Calibration
Empirical analyses are based on raw annual mortality data sourced from the Human Mortality Database. The dataset includes age-specific death counts and exposure figures from countries with records dating back to 1960, ensuring a robust time series for analysis. Maximum likelihood estimation techniques are applied to calibrate the models, ensuring that the estimated parameters faithfully reflect observed mortality patterns. These calibrated models are then used to forecast future trends and assess longevity risk in life insurance contexts.
8 Results
8.1 Observed Versus Fitted Data
The STAD model was applied to the female populations of Sweden, Japan, France, and Denmark using the mortality data described earlier. In this analysis, key demographic indicators such as remaining life expectancy at age 30 and the Gini coefficient of ages at death were used to assess model performance. These measures provide a comprehensive view of both the average longevity and the dispersion of lifespans, which are critical for evaluating mortality trends.
Graphical comparisons between observed and fitted values of e30 and G30 over the period 1980–2014 indicate a high degree of concordance for most countries. For example, in Sweden and Japan, the STAD model closely replicates the observed trend in life expectancy with only minimal deviations noted during certain years. In France, the fitted curves align well with the observed data, whereas Danish females showed slight irregularities in the early years, likely reflecting local demographic idiosyncrasies.
Furthermore, the model's performance was benchmarked against several variants of the Lee-Carter model. By using the Bayesian Information Criterion (BIC) to balance model complexity and fit, it was observed that the STAD model outperformed standard variants in some cases, particularly for Sweden and Denmark. However, for Japan and France, certain LC variants, such as the Hyndman and Ullah approach, provided competitive results.
8.2 Out-of-Sample Validation
To test the forecasting capability of the STAD model, a series of out-of-sample validations were conducted. The dataset was partitioned into fitting and validation periods across three forecast horizons: 10, 20, and 30 years. Point forecasts for e30, G30, and the logarithm of age-specific death rates were compared to observed values using the mean absolute error (MAE) as the evaluation metric. The results from these validations reveal that the STAD model offers competitive point forecast accuracy when compared with various LC variants. In nearly half of the indicators considered across the four countries, the STAD model produced the lowest MAE, with the LM variant ranking closely behind in overall performance. This indicates that the STAD model is robust in capturing the key mortality dynamics over different time horizons.
In addition to point forecasts, prediction intervals were evaluated to determine the model's ability to capture uncertainty in the forecasts. For the STAD model, bootstrapping techniques were used to generate 80% prediction intervals. When compared with those derived from LC variants, the STAD model demonstrated competitive interval forecast accuracy. The coverage probabilities of these intervals were within acceptable limits, further confirming the model's reliability.
Overall, the empirical results suggest that the parameterized STAD model is a viable alternative to traditional LC methods, offering both simplicity and interpretability while maintaining forecast accuracy in diverse demographic settings.
9 Evaluation
The performance of the STAD model was evaluated by comparing its fitted outputs with observed demographic measures. One of the primary strengths of the STAD approach is its ability to encapsulate complex mortality trends with a limited number of parameters, which simplifies both interpretation and estimation. This parsimony is particularly advantageous in the context of actuarial applications where clarity and precision are paramount.
In the comparative analysis, the STAD model demonstrated robust performance in reproducing the observed life expectancy and lifespan inequality measures across multiple countries. While some discrepancies were noted—especially in regions with unique demographic patterns—the overall fit was satisfactory. This suggests that the model is adaptable to diverse populations and can effectively capture both central tendencies and variations in mortality.
Moreover, the out-of-sample validation exercises further highlighted the model's predictive strengths. Across different forecast horizons, the STAD model consistently produced point forecasts with low mean absolute errors, outperforming or matching established LC variants. This consistency under varying conditions reinforces the potential of the STAD model as a forecasting tool in demographic and actuarial analyses.
The evaluation also considered the uncertainty associated with forecast intervals. By employing bootstrapping methods, the STAD model generated prediction intervals that were both reliable and interpretable. The close alignment of the empirical coverage with nominal levels indicates that the model is not only accurate in point estimation but also robust in quantifying forecast uncertainty critical aspect in risk assessment for life insurance.
Another important aspect of the evaluation was the model's ability to balance complexity with interpretability. The LS framework underlying the STAD model provides direct demographic meanings to its parameters, making it easier for practitioners to understand and communicate the implications of the results. This clarity can be particularly beneficial when communicating findings to stakeholders in the insurance and pension sectors.
In summary, the comprehensive evaluation of the STAD model demonstrates that it offers a promising balance of simplicity, accuracy, and interpretability. These qualities make it well-suited for both retrospective analysis and forward-looking mortality forecasting, thereby contributing valuable insights for managing longevity risk.
10 Conclusion
The study aimed to reframe classical mortality models within a modern, location-scale framework, thereby enhancing the interpretability and efficiency of mortality forecasting. By simplifying the parameter structure, the re-parameterized models provide a clearer understanding of the shifting and compression dynamics inherent in mortality trends. These insights are crucial for actuaries and demographers who must anticipate future longevity risk in an increasingly aging population.
The empirical results indicate that the STAD model, when applied to diverse populations such as those of Sweden, Japan, France, and Denmark, closely reproduces key mortality indicators like remaining life expectancy and lifespan inequality. The model's performance, assessed through both in-sample and out-of-sample validations, confirms its capacity to deliver accurate forecasts over multiple time horizons. This versatility is particularly significant given the varying demographic profiles encountered across countries.
One of the notable advantages of the re-parameterized approach is its ability to reduce the complexity often associated with traditional models. By focusing on two interpretable parameters—the shift and scale—the model not only simplifies estimation procedures but also minimizes the correlation among parameter estimates, thus reducing estimation bias. This leads to a more robust analysis that can inform premium pricing and risk management in life insurance more effectively.
The study also emphasizes the importance of prediction intervals in mortality forecasting. The STAD model's use of bootstrapping to generate these intervals provides a transparent measure of uncertainty, which is essential for understanding the risks involved in longevity projections. Accurate interval forecasts support better decision-making and risk assessment for financial institutions.
While the study presents compelling evidence of the advantages of the LS framework, it also recognizes the limitations inherent in any modeling approach. Some discrepancies in specific demographic contexts suggest that further refinements may be needed. Future research could explore hybrid models that integrate features of both the LS and traditional models to enhance forecast reliability even further.
In conclusion, the integration of classical mortality models into a location-scale framework offers significant promise for both retrospective analysis and forward-looking forecasting. The improved clarity and reduced estimation bias afforded by this approach hold the potential to advance the practice of mortality forecasting in the actuarial field, thereby aiding in the design of sustainable life insurance and pension systems.
References
- Preston, S., Heuveline, P., & Guillot, M. (2001). Demography: Measuring and Modeling Population Processes.
- Riley, P. (2001). Rising Life Expectancy: The Demographic Transition in Perspective.
- Oeppen, J., & Vaupel, J. W. (2002). Broken Limits to Life Expectancy. Science, 296(5570), 1029–1031.
- United Nations. (2019). World Population Prospects.
- Blake, D. (2014). Longevity Risk and Life Insurance.
- Michaelson, P., et al. (2014). The Impact of Longevity Risk on Financial Markets.
- Lexis, W. (1875). Lexis Diagrams in Demography.
- Camarda, C. (2008). Visualizing Mortality Data: The Lexis Diagram.
- Human Mortality Database. (2019). Mortality Data.
- Gompertz, B. (1825). On the Nature of the Function Expressive of the Law of Human Mortality.
- Kannisto, V. (1992). The Force of Mortality at Advanced Ages.
- Lee, R. D., & Carter, L. R. (1992). Modeling and Forecasting US Mortality. Journal of the American Statistical Association.
- DeMoivre, A. (1725). An Essay on the Nature of Life Contingencies.
- Smith, D., & Keyfitz, N. (1977). An Introduction to the Mathematics of Population.
- Forfar, D., et al. (2004). Testing the Gompertz Model of Mortality.
- Thatcher, A., et al. (1998). Evaluating Logistic Mortality Models.
- Makeham, W. M. (1860). On the Law of Mortality.
- Perks, H. (1932). Adjustments to Mortality Models.
- Wilmoth, J. (2019). Mortality Smoothing Techniques in Life-Table Construction.
- Thiele, E. (1871). Contributions to the Theory of Mortality.
- Siler, W. (1979). A Competing-Risk Model for Mortality.
- Heligman, L., & Pollard, J. H. (1980). The Age Pattern of Mortality.
- Kostaki, E. (1992). Extensions of the Heligman-Pollard Model.
- de Beer, D., & Janssen, J. (2016). A Ten-Parameter Model for Mortality.
- Mazzuco, S., et al. (2018). Mixture Models in Mortality Analysis.
- Zanotto, P. (2017). Extensions to Mixture Mortality Models.
© 2026 ScienceTimes.com All rights reserved. Do not reproduce without permission. The window to the world of Science Times.


