On July 20, astrophysicists published the largest-ever three-dimensional map of the Universe, the result of 20 years of analysis of more than four million galaxies and ultra-bright, energy-packed quasars with the Sloan Digital Sky Survey.
Will Percival of the University of Waterloo in Ontario, Canada, said that the efforts of scientists from 30 institutions worldwide had yielded a "complete story of the expansion of the Universe."
Measuring the Universe
More than two decades ago, the researchers launched a project that made "the most accurate expansion history measurements over the widest-ever range of cosmic time," says Percival.
The map is based on the latest observations made by the Sloan Digital Sky Survey (SDSS) entitled the "extended Baryon Oscillation Spectroscopic Survey" (eBOSS), together with the data collected from an optical telescope in New Mexico over six years.
Following the Big Bang, the infant Universe is relatively known through extensive theoretical models and observation of the electromagnetic radiation of the nascent cosmos or known as the cosmic microwave background.
Additionally, studies of different galaxies and distant measurements have contributed to a deeper understanding of the expansion of the Universe for over billions of years.
'Troublesome gap in the middle 11 billion years'
However, Kyle Dawson of the University of Utah said they had tackled a "troublesome gap in the middle 11 billion years." He said that through five years of continuous observations, they have worked to fill in that gap and use that information to deliver some of the most significant cosmology advances in the last ten years.
Their study aims to make the most complete 3D map of the Universe throughout its lifetime, said astrophysicist Jean-Paul Kneib of the Swiss Federal Institute of Technology (EPFL) in Lausanne, who initiated eBOSS in 2012.
The researchers used the data on the celestial objects that indicate the distribution of matter throughout the Universe, as well as the galaxies actively forming stars and quasars.
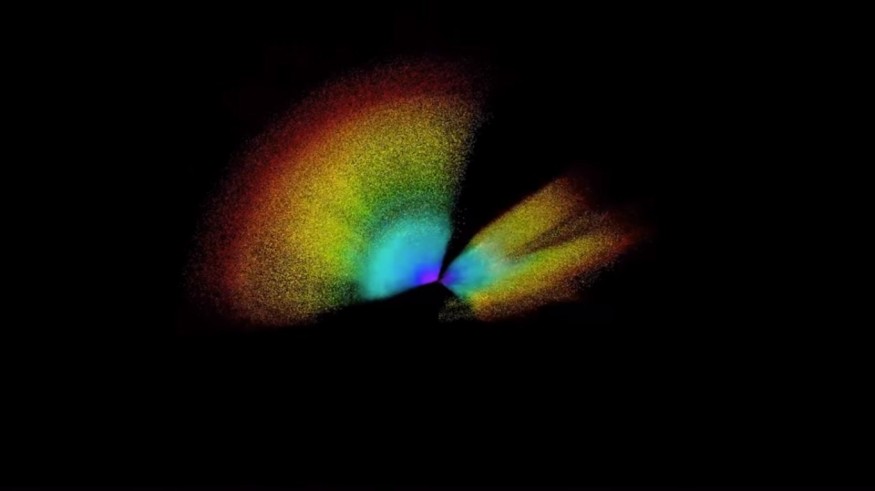
The 3D map of the Universe shows filaments of matter and voids that define its beginning when it was only about 380,000 years old. At the same time, researchers observed the oldest and reddest galaxies to show the Universe six billion years ago.
On the other hand, the researchers concentrated on the youngest galaxies (blue galaxies) to show those more distant eras. Going back even further, the researchers used quasars or galaxies that have an extremely luminous central region.
It is also seen on the map how the expansion of the Universe began until it accelerated at some point and continued to do so. They said that the Universe's expansion could be due to dark energy, or the invisible element that Albert Einstein's general theory of relativity is talking about but with an unknown origin.
Although astrophysicists have long known that the Universe is expanding, they are still unable to measure its expansion rate precisely. They have tried comparing the observations by eBOSS with previous studies of early Universe, but it only revealed discrepancies in estimates of the rate of expansion.
Scientists currently have an accepted rate called the "Hubble constant," which is 10% lower than the value calculated from the distance of galaxies closest to the Milky Way.
© 2026 ScienceTimes.com All rights reserved. Do not reproduce without permission. The window to the world of Science Times.


