A designer reimagines the periodic table and shows what it should look like in the 21th century. The EdTech startup is free for students and everybody else.
The periodic table is one of the best-known scientific concepts, alongside equations like E=mc2 and theories like the Big Bang. It's a symbol of the entire chemistry and is studied by everyone in school. The periodic table has a rich history, dating back to its discovery by Dmitry Mendeleev, and has changed many shapes over time, even though its essence remains the same as a visual representation of the periodic law.
In today's world, many things are being reinvented. Let alone phones and cars, even light bulbs are now multi-colored and controlled remotely. Interface designer Andrey Markelov (or Andrew Marcus) reimagined the periodic table, making it as interactive as Google Maps when compared to its traditional paper format.
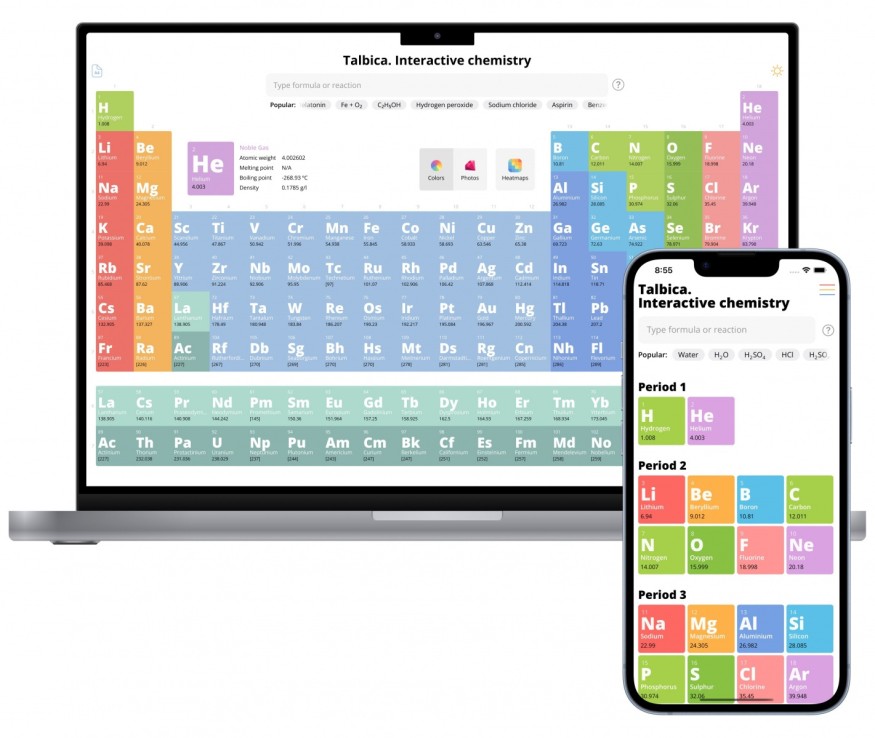
The project is called "Talbica: Interactive Chemistry", and it is available as a website and a mobile application for both iOS and Android.
Data paradise
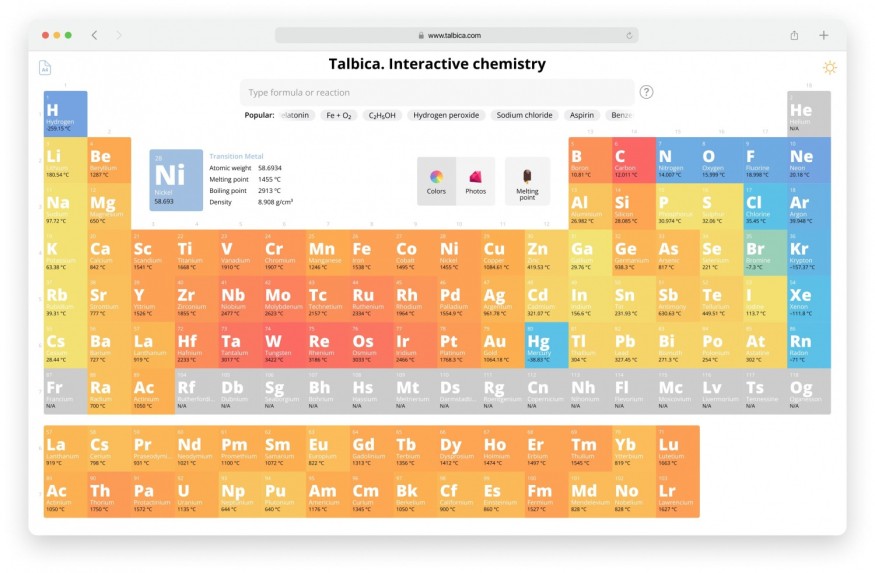
The periodic table is a paradise, and not only for chemists but for designers too. Each element has dozens of properties that can be presented in an engaging way, rather than just dry numbers.
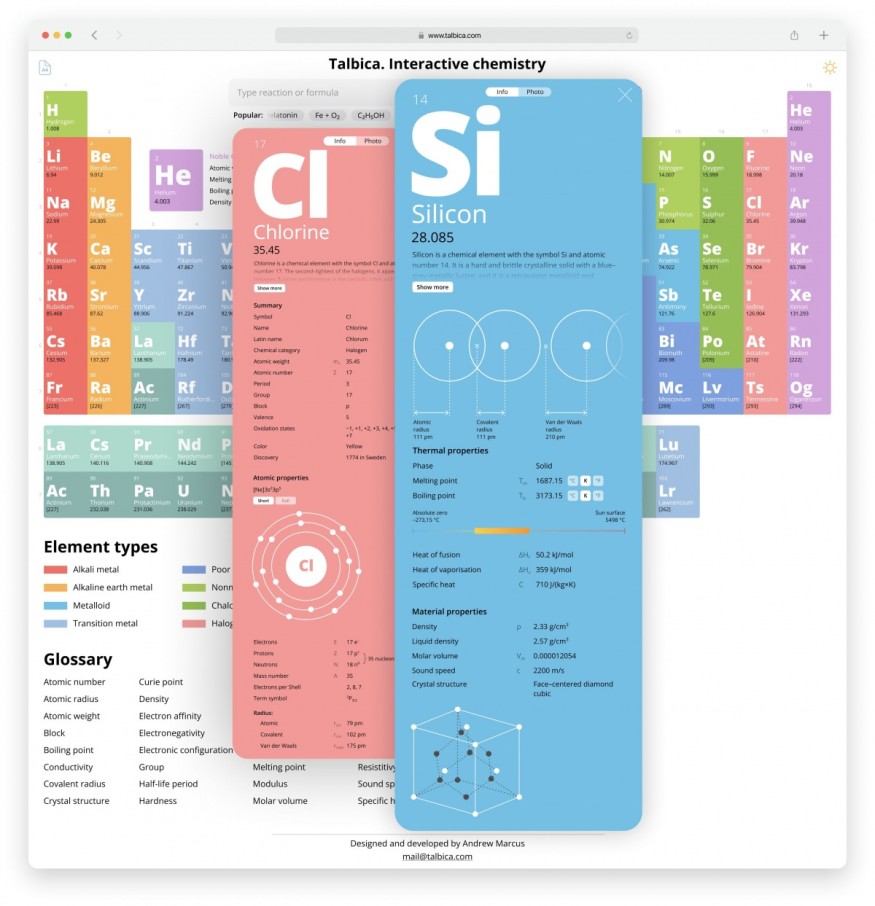
Let's start by adding a third dimension to the table and opening an information card that nicely zooms-in when an element is clicked. Here, we will have plenty of space to feature element's properties by splitting them into groups: atomic, thermal, chemical, and so on. For such properties as melting temperature, we can add infographics. How hot is it, 1538 Celsius? To dress up the numbers, let's put them on the scale from absolute zero to the Sun's surface temperature. Covalent and Van der Waals radiuses can tell much more when they are put on a scheme. Atomic models, crystal structures, and spectral lines are hardly useful without graphics.
Still, info cards cannot show how properties change among groups and periods, and this is the core of the periodic law. Suppose we want to see the distribution of melting temperature throughout the table, how can we do this? Talbica introduces Heat Maps, a stunning feature for data visualization.
Select the melting heat map, and the periodic table will turn into a gradient map from deep blue to vivid orange. The greater the element's melting point, the redder its color; if it melts below zero, it would get a color from the blue range.
It is calculated that learning chemistry is 3.14 times more interesting when it can be seen.
Talbica has 6 built-in heat maps, each with a unique vivid color palette that are so cool users won't be able to resist clicking on them. Late night is not the reason to stop, thanks to the dark mode that makes heat maps look even more fantastic.
A cosmic photo album

The impression wouldn't be full without actual pictures. Talbica features almost 90 high-resolution photos of all elements that can be photographed. Others are just too radioactive to capture them. Talbica's "Photo mode" will show the table in its natural beauty. It replaces the color-coding with a small photo of each element, while the background turns into a space travel animation. Remember, that all started with the Big Bang?
Photos of elements are priceless for school students. With photos, the table is not a dull chart anymore, but an engaging educational tool that can be explored for hours.
From elementary to molecular
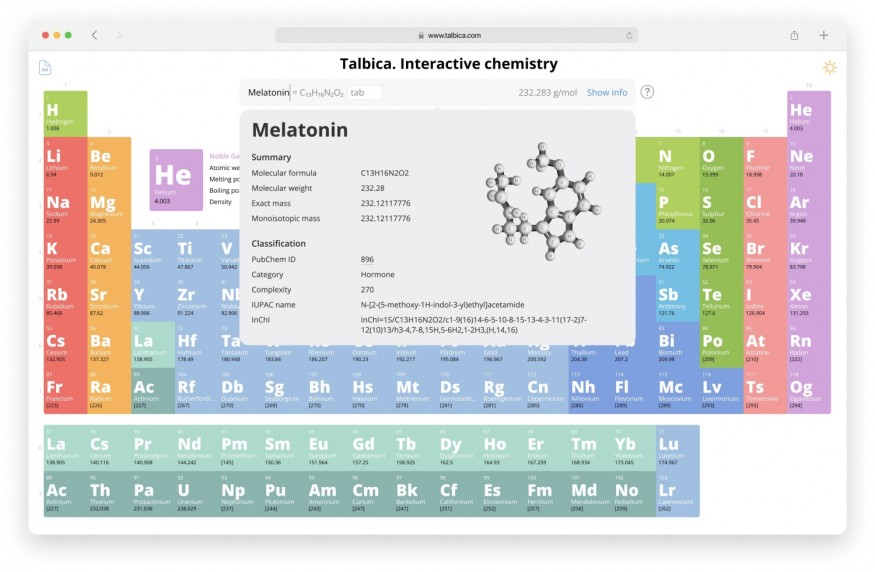
In addition to the elements, Talbica features compounds and reactions. Its database includes 4,500 chemical substances, from as simple as sulfuric acid to as complex as melatonin. Each compound has many properties and most include a 3D molecular model, which can be rotated and zoomed.
To learn about a compound, users can simply type its formula or name in the "Smart field" above the table. This all-in-one tool not only searches formulas, but also solves reactions and calculates molar mass.
The database also includes 6,000 most popular chemical reactions. Chemists can just type a formula and get a list of reactions where the compound acts as a reactant or product. Alternatively, users can type a partial reaction, hit "Enter", and get the full and balanced reaction with environmental conditions.
Talbica is a unique tool that offers this feature, as many chemists still rely on outdated paper reference books.
"I created the whole project alone, from scratch," said Andrew. "I am the designer and developer. Most people don't understand how it's possible. Actually, when you combine two roles, you can skip the design part and just code. I can see the whole interface without visualizing it. When I was asked to provide design samples for an award, the project had already been launched, but I didn't have the design. Had to draw from life".
Speaking about his future goals, Andrew said that he wants to "create the best learning and reference tool for chemistry students and laboratory workers. Regarding the monetization, I think I'll come up with a form of a subscription."
© 2026 ScienceTimes.com All rights reserved. Do not reproduce without permission. The window to the world of Science Times.


