An interview with Oleksandr Kryvoshein, senior researcher at EOS Data Analytics, on the launch of the company's first agro-oriented satellite and how it is going to help with sustainable agriculture practices.
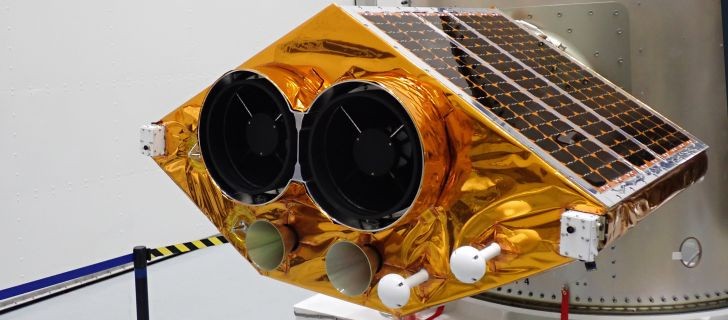
On January 3, 2023, EOS Data Analytics, a global provider of AI-powered satellite imagery analytics, launched its first agriculture-oriented satellite named EOS SAT-1 into a low Earth orbit.
It's the first spacecraft of the EOS SAT project, the world's first solely agri-focused constellation of seven satellites launched by a company utilizing remote sensing technologies.
Read on to find out why it is important for the future of the agriculture industry and food security.
Oleksandr, thousands of satellites are launched into a low Earth orbit every year. Tell us how EOS SAT-1 is different from others.
To answer this question, I must first explain the reason why we decided to build a satellite constellation in the first place.
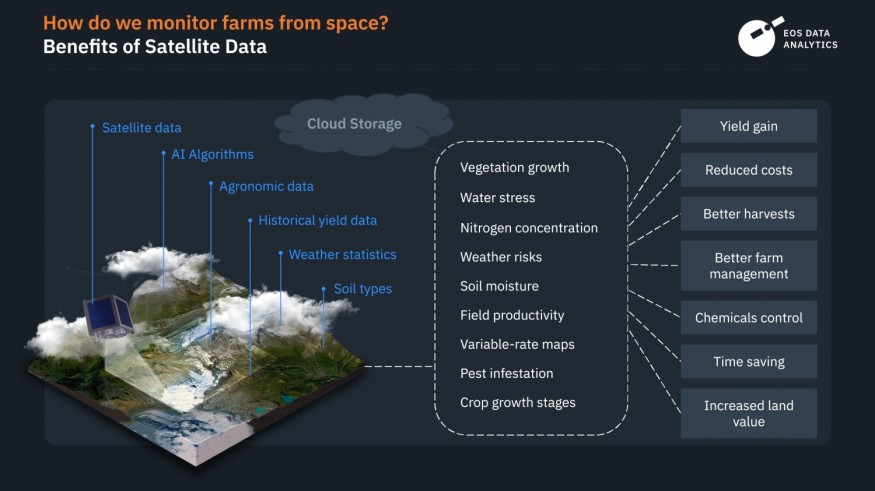
Our company's solutions process satellite data to produce meaningful insights and analytics for our clients. This data is utilized both directly and indirectly.
Direct utilization means we get satellite images to analyze the current state of vegetation, moisture in the soil, canopy status, and other factors of crop development dynamics in various circumstances. For that, we make photos of the planet in different bands and then combine those photos to calculate the vegetation indices of the area.
An indirect utilization means we also use the same satellite data to train and improve our machine learning models so that they would provide even more accurate analytics in our products.
To progress in the accuracy of our analytics, we must continuously improve three factors:
1. The amount of satellite data
2. The number of bands in which we can take photos of the planet
3. The resolution of the images
Earlier, we were relying only on third-party satellite data, so we could not affect any of these factors. With EOS SAT-1, we become a full-cycle data processing company that has control over both the collection of data and its analytics.
So EOS SAT-1 provides you with more images of higher resolution in a bigger number of bands? And the constellation will multiply this effect?
Yes, but let's be more specific here.
With seven more satellites in the sky, we want to achieve a one-day revisit of specific areas on customer demand through field-level tasking (by default, any territory will be revisited every 5-6 days). Such frequency allows us to notice potential troubles with the crop as early as possible and generally makes analytics and forecasts more precise.
At the same time, the EOS SAT constellation will be able to monitor at least 8.6-9.4 million square kilometers of total area per day according to our calculations. Since EOS Data Analytics has clients all over the world, we must be able to reach the above-mentioned one-day revisit time for any arable land on the planet if requested.
As you see, the increase in satellite data is most beneficial for agriculture businesses.
Moving on to bands.
Satellite sensors, also known as imaging spectrometers, can detect light in wavelengths that are invisible to the human eye. Still, the amount of light in specific wavelengths can provide extra information on crop or land features. For instance, the light in infrared bands allows measuring levels of chlorophyll in plants, and images made in ultraviolet bands can reveal forest fires.
EOS SAT satellite sensors will capture photos of the Earth using a unique set of 13 agri-related bands in total.
Red, Green, and Blue spectral images to visualize what we can normally see
2 NIR (near-infrared) channels to monitor chlorophyll levels and contrasting water bodies
3 RedEdge spectral bands to track nitrogen and fertilizer application in plants
WaterVapor and Aerosol bands to monitor moisture both in the soil and the air
A Pan spectral band to have sharper images and be able to highlight more details
2 SWIR (short-wave infrared) channels to assess crop maturation and predict water stress in crops and soil.
This is the main reason that allows us to state that EOS SAT is a truly agro-oriented constellation of satellites.
I should also note here that being the first satellite in the constellation, EOS SAT-1 will make images in 11 spectral bands, that is in all of the above-mentioned bands excluding the SWIR ones.
If EOS SAT satellites make images in different bands to monitor various vegetation characteristics, what is left there to analyze by your products?
Satellite images themselves don't tell anything to our users. What they want to have are quantitative data and visualized dynamics of their land productivity, like how soil moisture has been changing over a season, or if the current vegetation is OK for the current crop stage compared to previous years.
For that, we use various vegetation indices. Simply put, a vegetation index is a value calculated using data from a few spectral bands. However, if you calculate such an index for every single spot on your land and make something like a heatmap of these values, you will see how your vegetation varies throughout your area of interest.
Combined with historical data that EOSDA collects as well, a farmer can easily visualize how their crops have been changing over time in almost every aspect, because the amount of vegetation indices we track is quite comprehensive:
Modified soil-adjusted vegetation index to track crop growth at the beginning of the season, when the soil is still bare and seedlings only start to establish
Normalized difference vegetation index to track crop growth in the middle of the season
Red-edge chlorophyll vegetation index to monitor the photosynthetic activity of the canopy cover during active vegetation development
Normalized difference red edge vegetation index to analyze the state of the crops during their maturity
Normalized difference water index to detect floods and wetlands and monitor irrigation effectiveness
Normalized burn ratio to detect active wildfires

The total number of indices we are able to calculate, track and visualize keeps growing, and currently, there are up to a dozen more indices in addition to the ones I mentioned above.
Then, these index calculations are also used by machine learning models to classify types of crops, predict future yields, and provide agribusinesses with insights on how to take better care of their lands.
And having more images in higher resolution allows performing more precise index calculations?
Exactly, but it gets more interesting than that.
The higher frequency of photos is also important because sometimes the weather affects the images and tampers with the data our software analyzes. For best results, the sky over the area of interest should be clear, and taking more photos increases the chances of getting such weather conditions or deducting their effect on the data.
Higher resolution also allows calculating vegetation indices for smaller areas of crops, making it possible to detect vegetation problems in the early stage.
However, scientifically speaking, there are three types of resolutions for satellite sensors.
Spectral resolution defines the wavelengths of the spectrum a satellite sensor can measure. As I said earlier, EOS SAT-1 is able to make images in 11 bands, with the following spacecrafts in the constellation bringing this number up to 13.
Temporal resolution is the time it takes to make two images of the same spot. All these years we've been using photos from third-party satellites like Sentinel 2 and Landsat 8, and by supplementing this data with images from EOS SAT-1, we will reach even better revisit times for all our clients' areas of interest.
Spatial resolution defines the area covered by one pixel in a satellite photo. NASA's Landsat has a 15-meter resolution, which means one pixel covers an area of 15x15 meters, while EOS SAT-1 has a 3-meter resolution, and we are able to reduce it to 1,5 meters via a panchromatic band.
Now it's clear how EOS SAT-1 is different in terms of technical characteristics. But what about its purpose? You have been using third-party satellites for agriculture needs before; is your own satellite different in this regard?
Apart from addressing 'ordinary' agriculture needs, new data from EOS SAT-1 will help solve various climatic issues. This became possible because lately we've been focusing on the idea of sustainable agriculture, and one of its scientific challenges is finding ways to tackle and adapt to climate change.
A webinar where Oleksandr Kryvoshein and his colleagues explain how EOS SAT is beneficial for sustainable agriculture. Video: EOS Data Analytics
For instance, the EOS SAT constellation will help solve different problems concerning CO2 levels because its data will allow an accurate estimation of soil carbon sequestration. And features like improved yield estimation and anomaly detection are already helping to avoid food supply crises and produce more with less, the challenges caused mostly by climate changes, all over the world.
This is very inspiring. Thank you for the interview. One last question: what do you find the most amazing thing about the EOS SAT constellation?
Well, let's imagine a situation on the field: the total biomass of the crop is large, the vegetation indices show high values, but the actual yield appears to be... unexpectedly small. Often, it happens because of the lack of warmth or rainfall during the sustainable development stage of the crop, which makes it impossible for the grains to reach their final size, so to say.
To prevent such situations, we create a multifaceted biophysical model that helps us track agrometeorological conditions of the crop throughout the whole vegetation period and deliver more precise insights and predictions about it for our end users.
New data provided by EOS SAT will help us calibrate this model even further, and I can't wait to see how it will show itself in future predictions and estimations and become an indispensable part of efforts aimed at fighting climate change.
© 2026 ScienceTimes.com All rights reserved. Do not reproduce without permission. The window to the world of Science Times.


